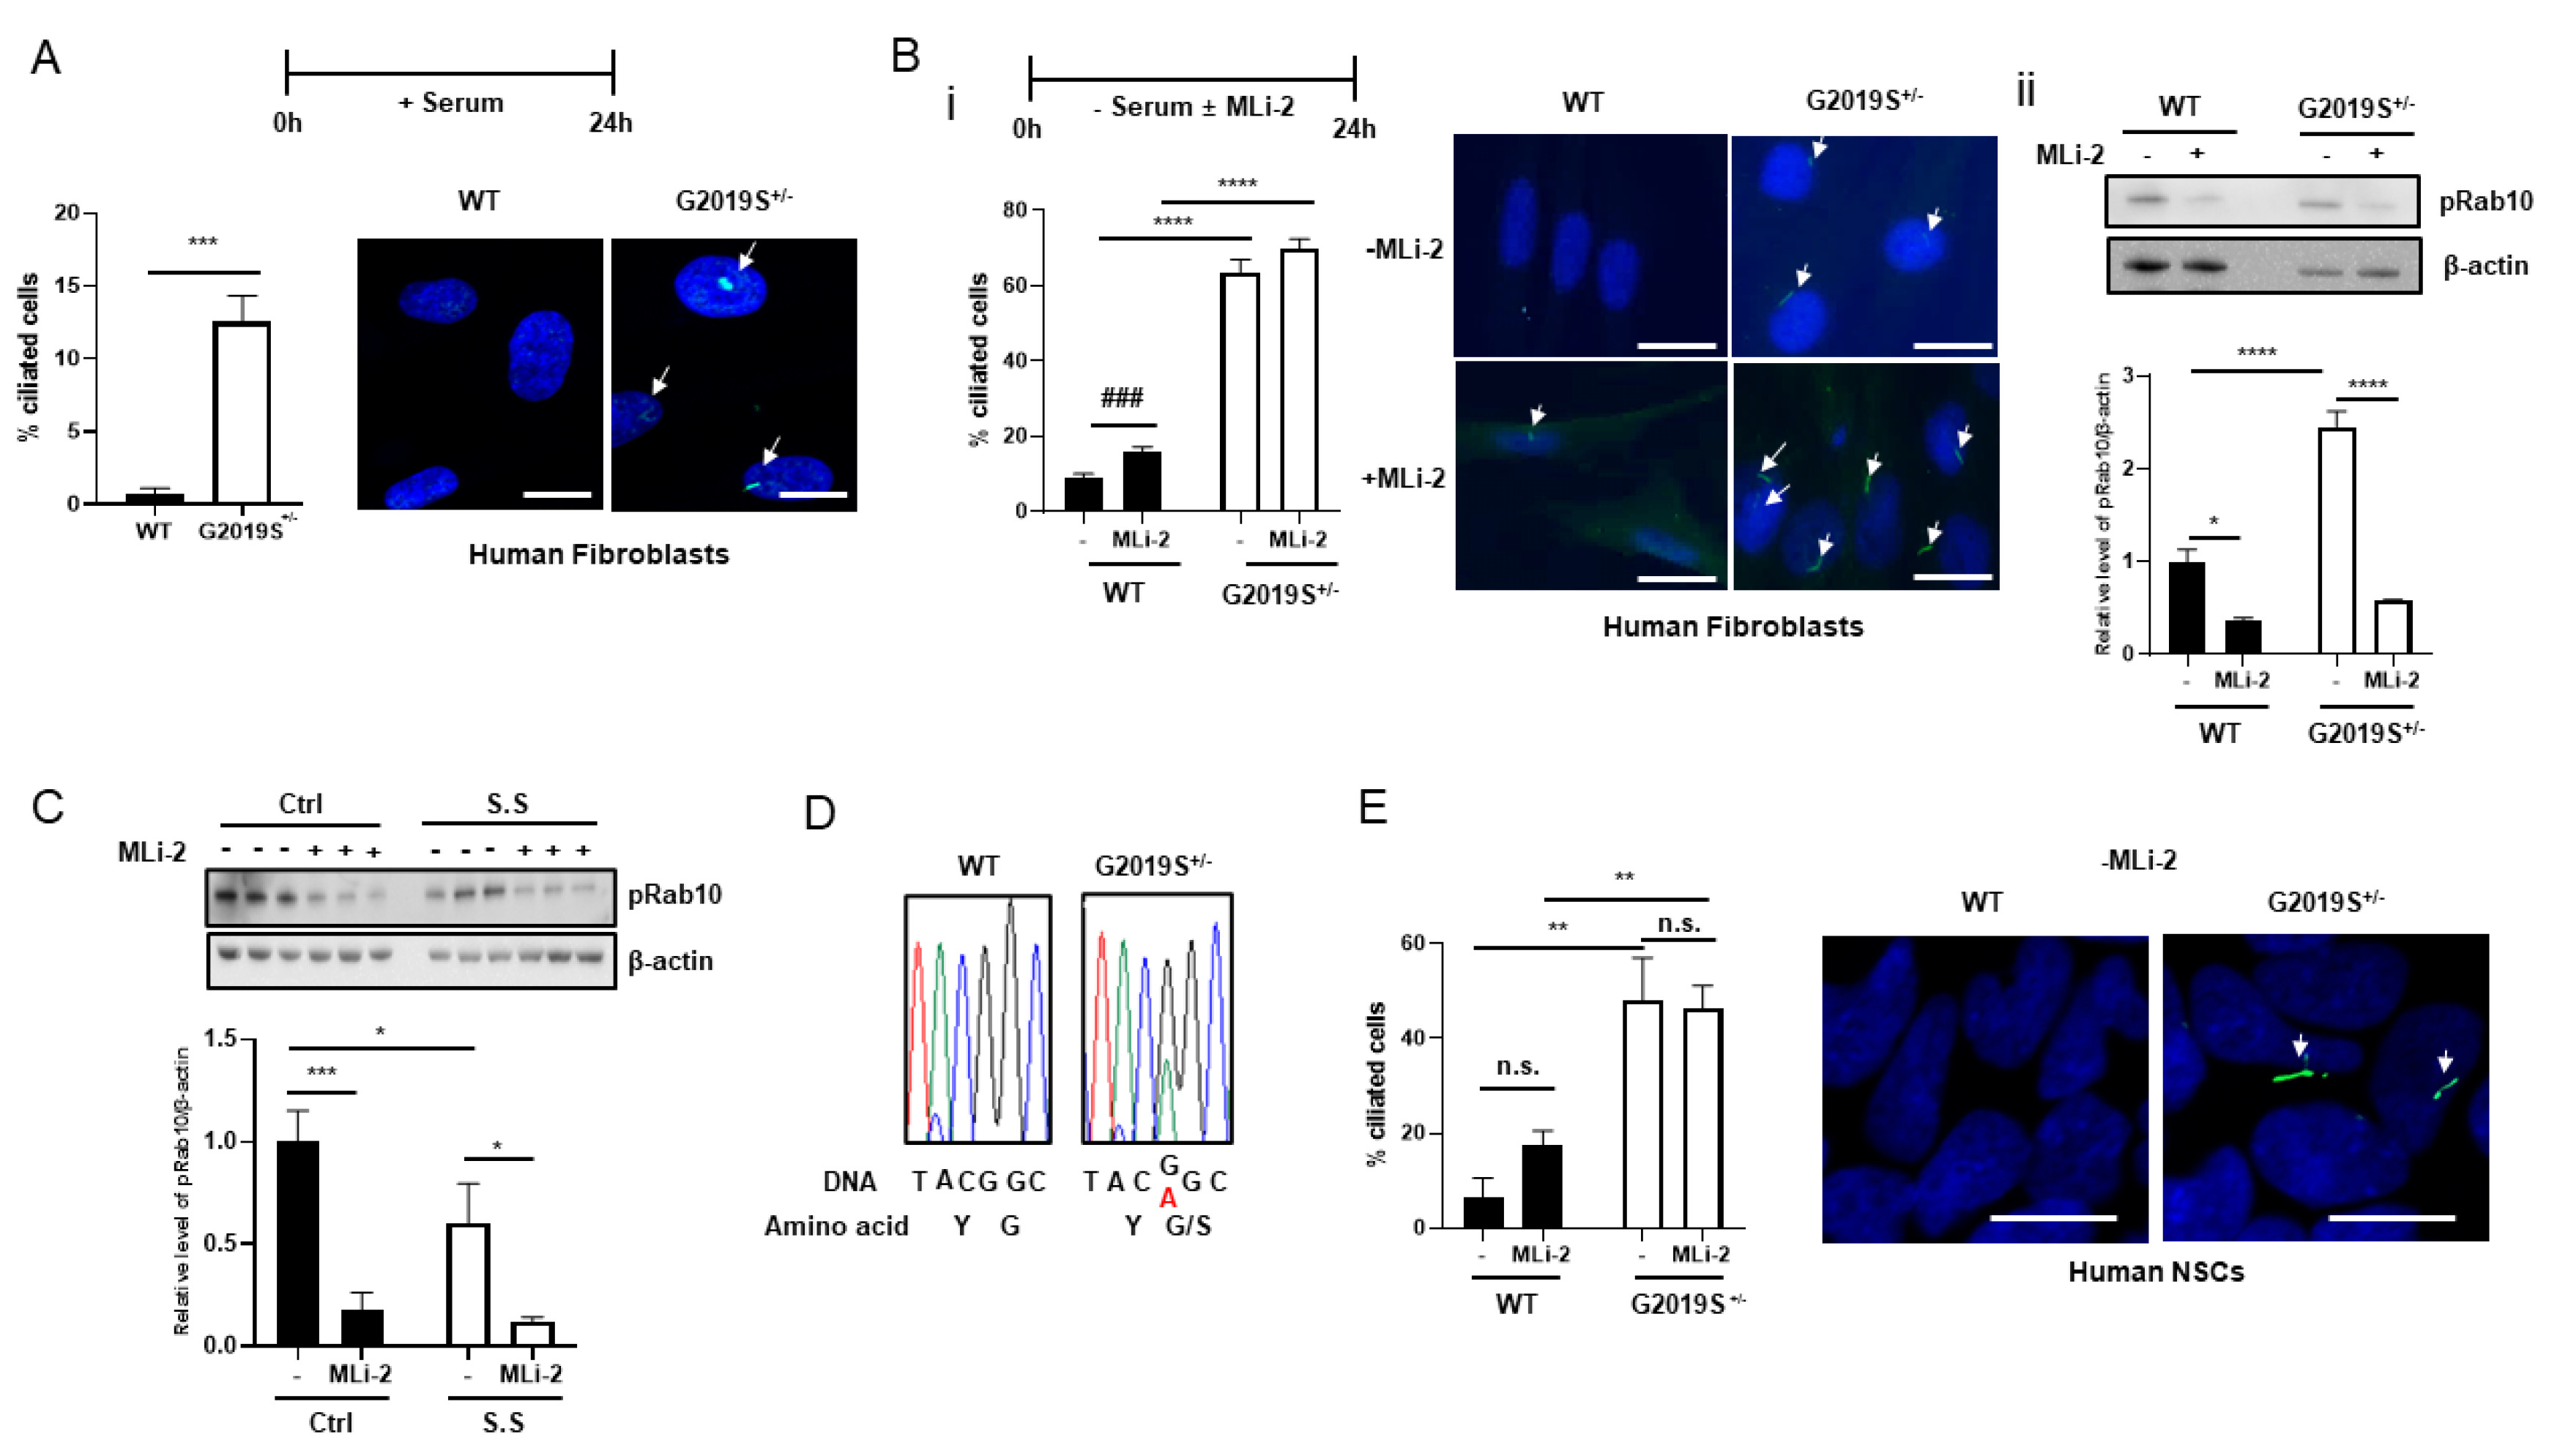
Fig. 3. Ciliogenesis of LRRK2 G2019S+/- (ND38262) and WT (MRC5) fibroblasts (A~D) and NSCs (E). All human fibroblast cells were cultured under serum-fed (A) or starved (B, C) conditions, and the Arl13B+ (green) ciliated cells were counted. (A) A total of 89~102 cells in five images were analyzed. (B) Ciliogenesis of fibroblasts after treatment with DMSO (control, -) or 100 nM MLi-2 for 24 h. i) Summary graph and each representative image. A total of 370~518 cells in 6~7 images were analyzed. ii) The LRRK2 kinase activity of each sample was analyzed by Western blots. The levels of pT73-Rab10 proteins were normalized to β-actin levels and the results are shown as a graph. (C) LRRK2 kinase activity after serum starvation (S.S) and 100 nM MLi-2 treatment for 24 h. LRRK2 kinase activity was analyzed by the same method as Fig. Bii. (D) The genotype of each cell type was confirmed by DNA sequencing. (E) An NSC pair derived from iPSCs that were prepared from the same LRRK2 G2019S+/- and WT fibroblasts were analyzed for ciliogenesis after 100 nM MLi-2 treatment for 24 h. A summary graph and a representative image for each cell type without MLi-2 treatment are shown. A total of 98~125 cells in four images were analyzed. Scale bar: 20 μm. The white arrow indicates a ciliated cell. *p<0.05, **p<0.01, ***p<0.001, ****p<0.0001 by ANOVA. ###p<0.001 by the t-test.
© Exp Neurobiol