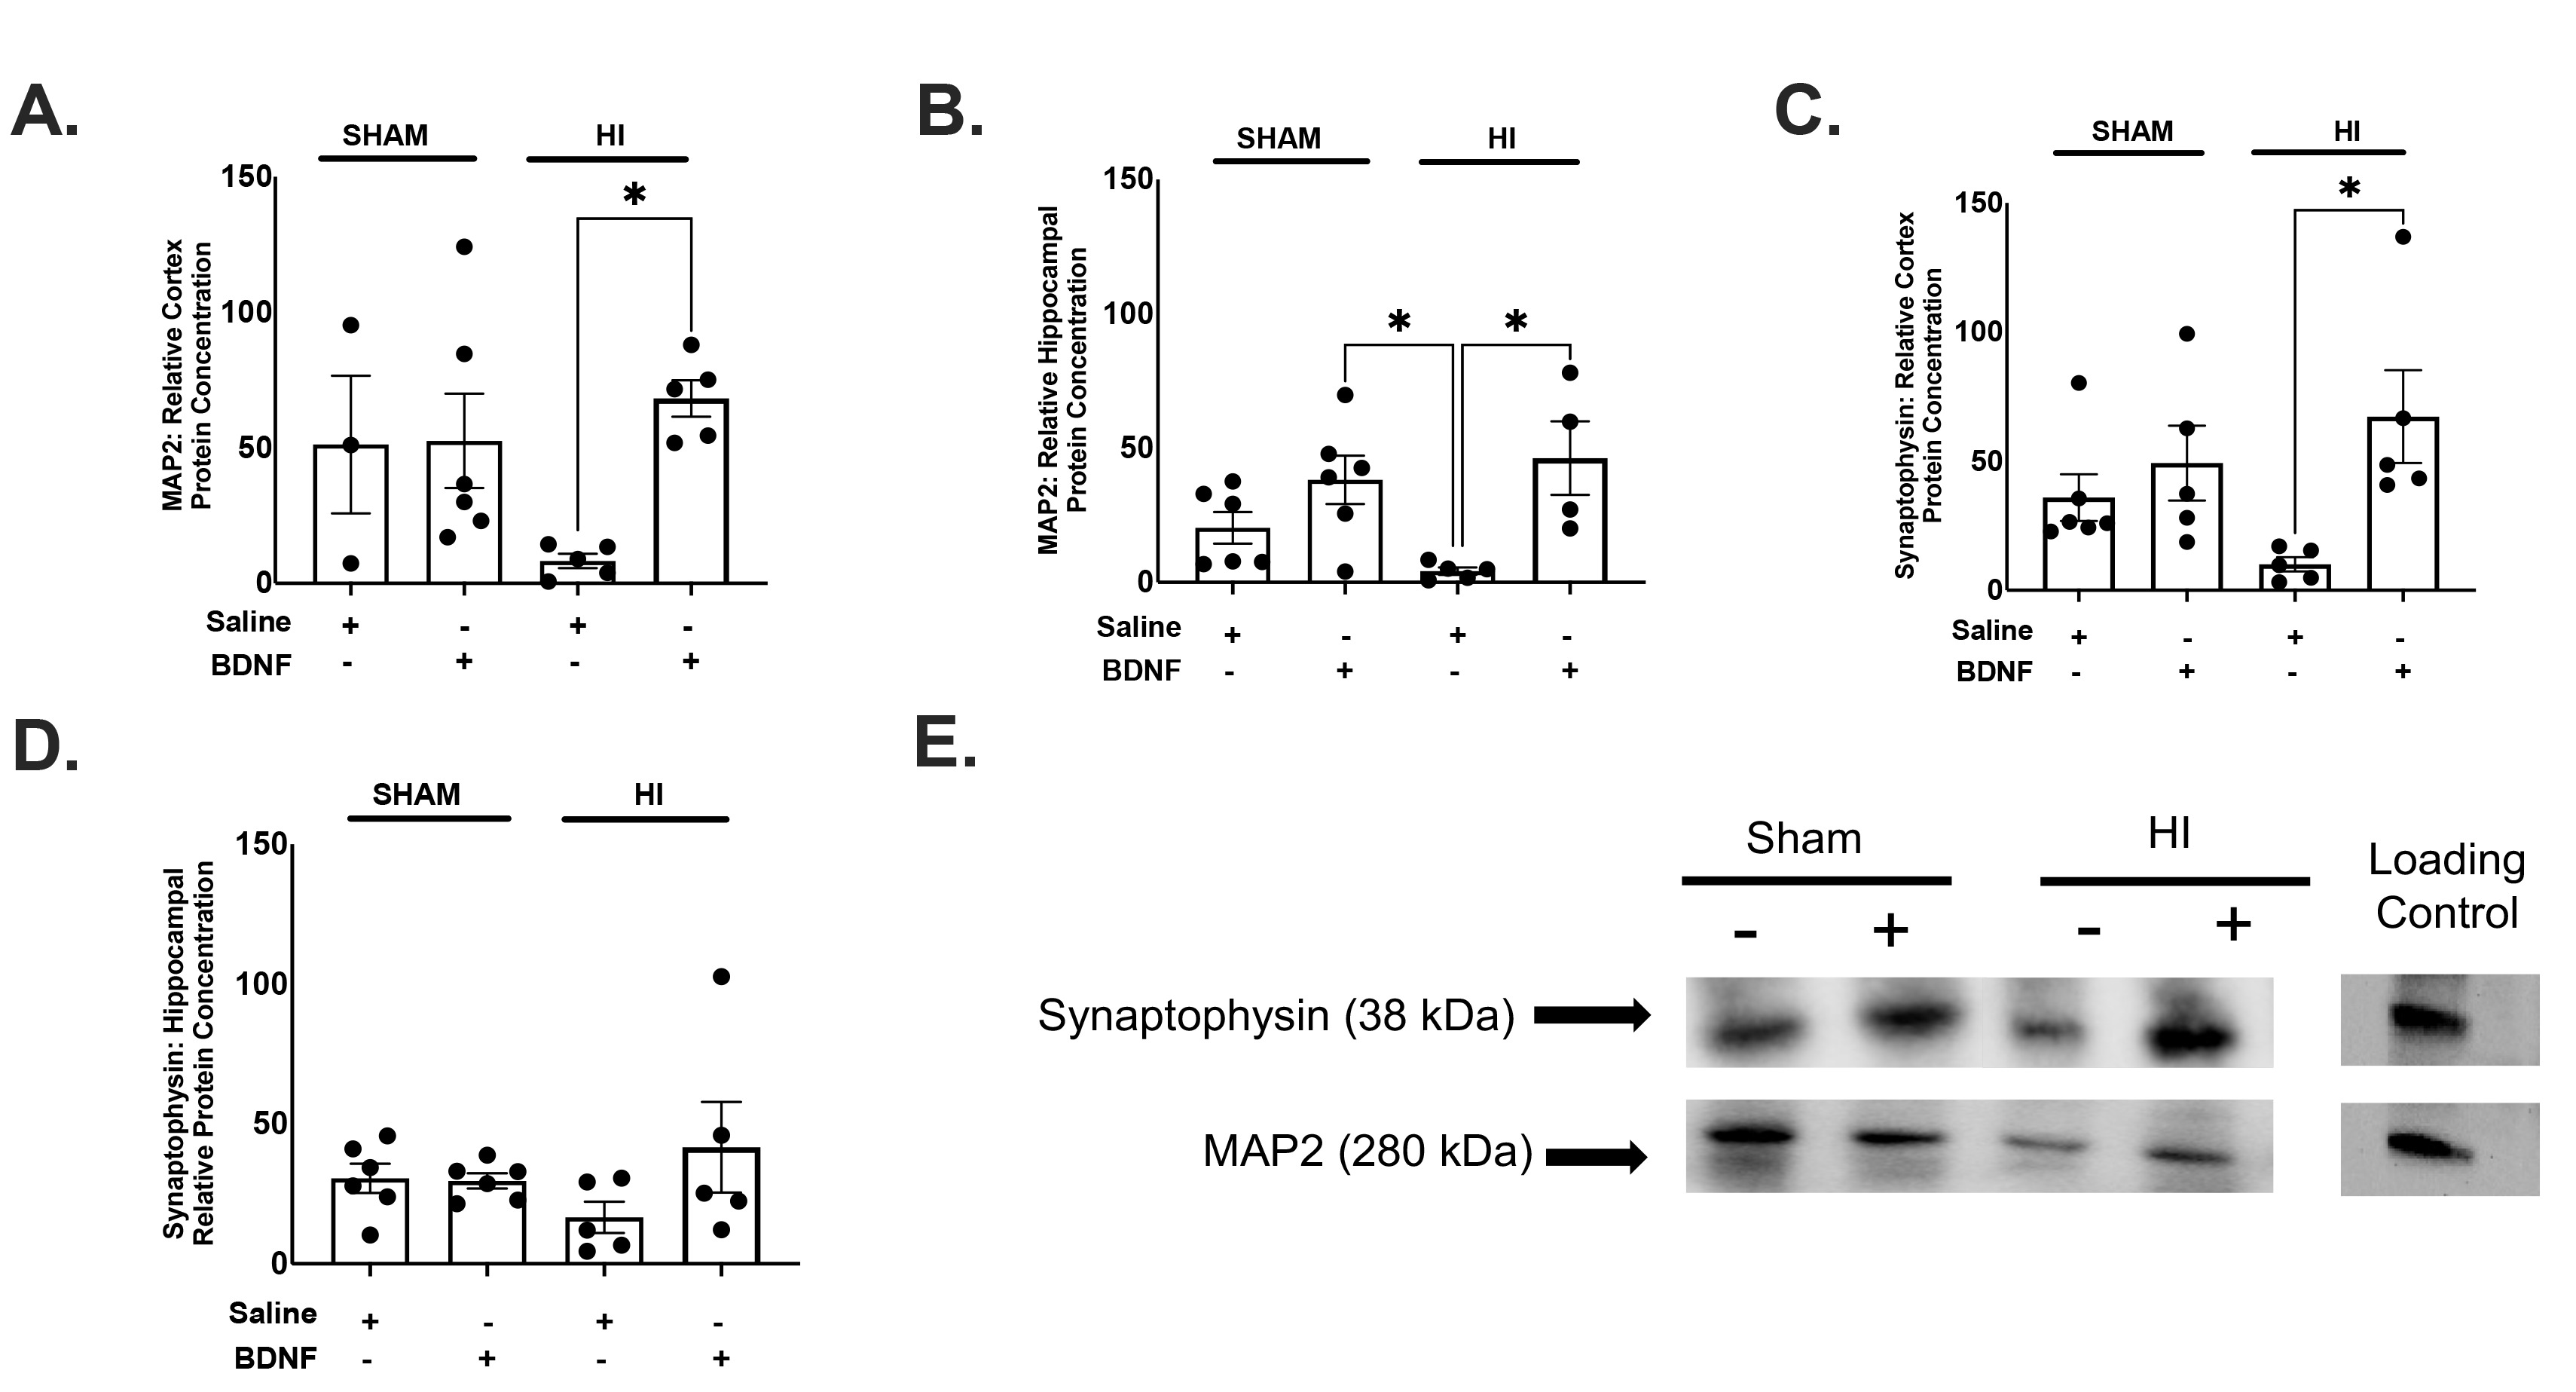
Fig. 4. MAP2 and synaptophysin Western analysis in neonatal mice with HI. Both microtubule associated protein 2 (MAP2) and synaptophysin were measured through western analysis within the cortex and hippocampus within mice. One-way ANOVA revealed that there was a statistically significant difference between groups analyzed in the cortex(F(3,18)=3.864, p=.0270) and hippocampus (F(3,17)=5.017, p=.0113). (A) Cortex MAP2 Western Analysis demonstrated an increase in microtubule associated protein-2 in HI+BDNF animals compared to both HI+saline (p=.0218). (B) Hippocampal MAP2 Western Analysis demonstrated an increase in microtubule associated protein-2 in HI+BDNF animals compared to both HI+saline (p=.0160). Western analysis also revealed a decrease in MAP2 in HI+Saline animals compared to SHAM+BDNF animals (p=.0332). One-way ANOVA was performed to compare the effect of intranasal BDNF on synaptophysin within the cortex and hippocampus. A one-way ANOVA revealed that there was a statistically significant difference between groups analyzed in the cortex (F(3,17)=3.720, p=.0319) but not within the hippocampus (F(3,18)=1.371, p=.2835). (C) Cortex Synaptophysin western analysis demonstrated greater protein concentration in HI+BDNF compared with HI+Saline (p=.0228). (D) Hippocampal Synaptophysin western analysis demonstrated no significant differences between groups. (E) Representative immunoblot for the loading control, Synaptophysin (38 kDA), and MAP2 (280 kDA). The data is presented as ± standard dev. of the mean; n=5~6 per group. *p≤0.05.
© Exp Neurobiol