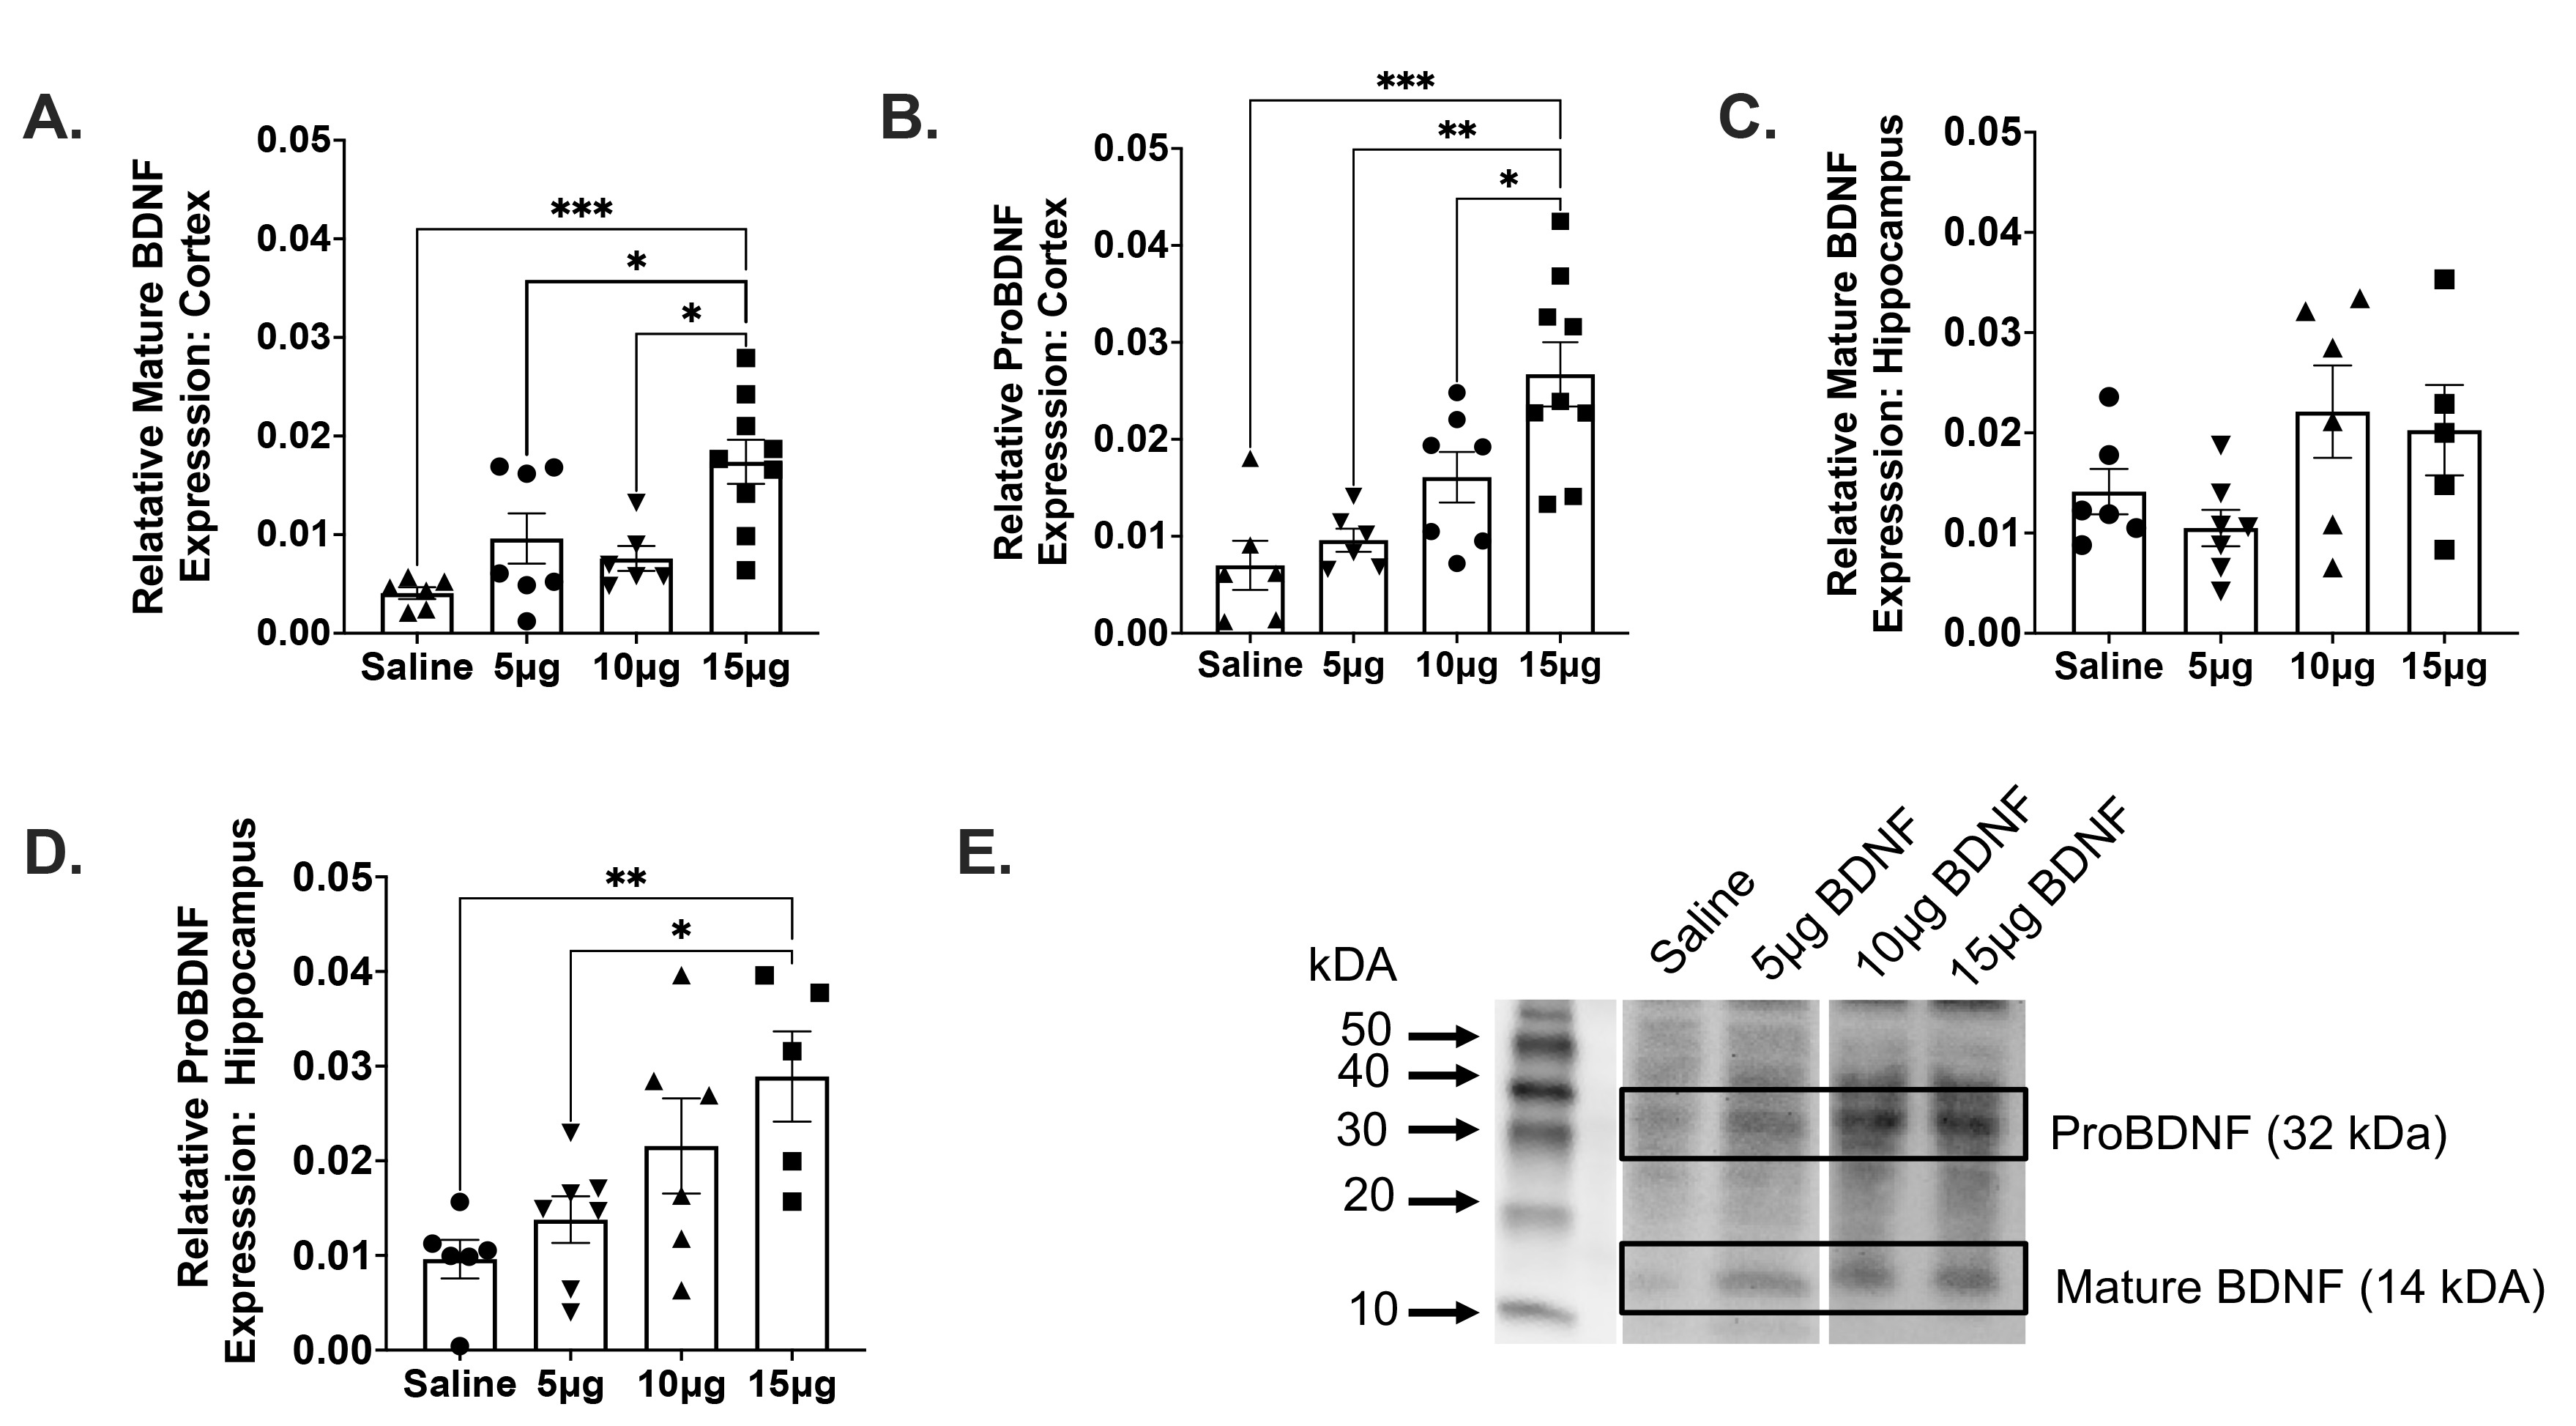
Fig. 2. Western immunoblotting relative mature and proBDNF protein expression levels In Neonates. Relative BDNF expression (mg/ml) in neonatal cortex samples after intranasal administration of various concentrations of BDNF based on western immunoblotting. One-way ANOVA revealed that there was a statistically significant difference among groups analyzed for both mature BDNF (F(3,24)=8.439, p=.0005) and proBDNF (F(3,24)=10.76, p=.0001) within the cortex. (A) Greater concentrations of BDNF resulted in greater BDNF protein levels (Saline vs. 15 µg, p=.0393), (5 µg vs. 15 µg, p=.0102), (10 µg vs. 15 µg, p=.0005). (B) Greater concentrations of BDNF resulted in greater proBDNF protein levels in the cortex (Saline vs. 15 µg, p=.0411), (5 µg vs. 15 µg, p=.0010), (10 µg vs. 15 µg, p=.0002). One way ANOVA revealed that there was also a statistically significant difference between groups analyzed for proBDNF F(3,20)=5.102, p=.0088) within the hippocampus. (C) Relative BDNF expression (mg/ml) in neonatal hippocampal samples after intranasal administration of various concentrations of BDNF resulted in no significant differences between groups. (D) Greater concentrations of BDNF resulted in greater proBDNF protein levels in the hippocampus (Saline vs. 15 µg, p=.0094), (5 µg vs. 15 µg, p=.0409). (E) Representative western blot for saline, 5 µg, 20 µg, and 15 µg of intranasal BDNF for mature BDNF (14 kDa) and ProBDNF (32 kDa). The data is presented as ± standard deviation (SD) of the mean; n=5~6 per group. *p≤0.05, **p≤0.01, ***p≤.001.
© Exp Neurobiol