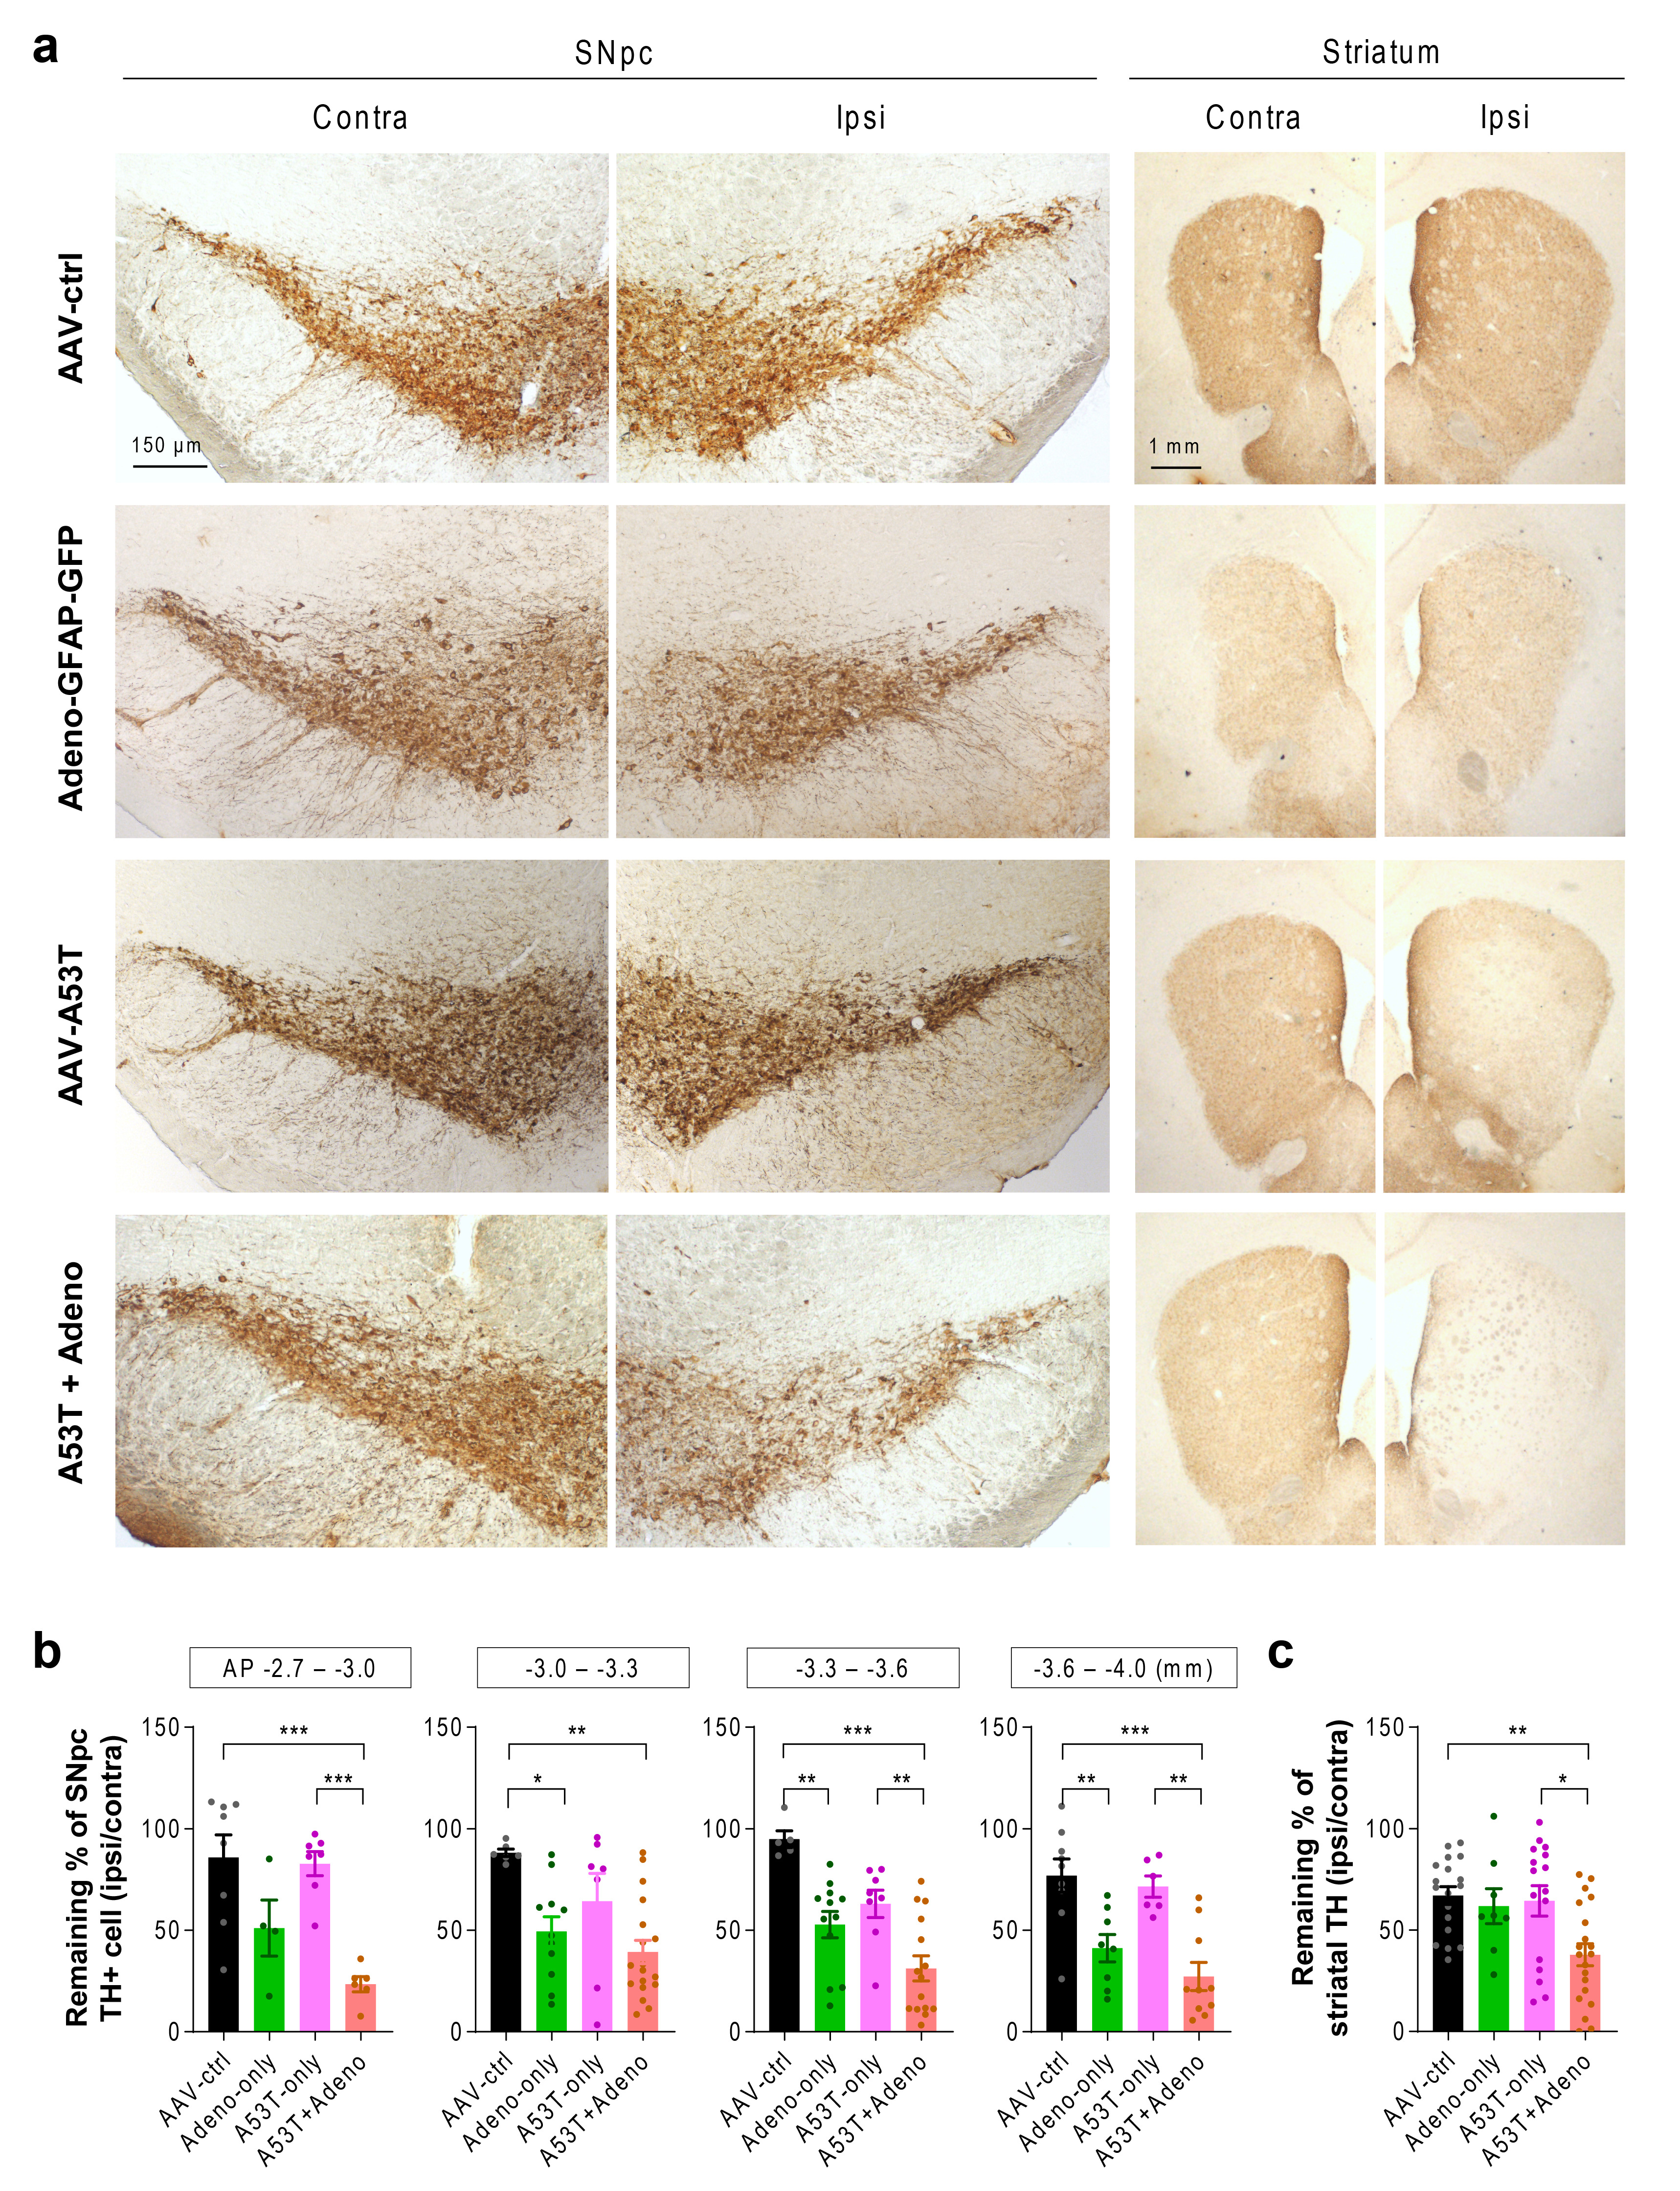
Fig. 2. Adenovirus injection exacerbates A53T-mediated TH loss. (a) Representative images of TH-stained SNpc tissues (left) and striatal tissues (right). (b) Quantification of TH-positive (TH+) neurons in the SNpc (at the AP coordinates of -2.7~3.0, -3.0~-3.3, -3.3~-3.6, -3.6~-4.0 mm). (c) Quantification of TH optical density in the striatum. For all figures, mean±SEM; ns, non-significance; *p<0.05, **p<0.01, ***p<0.001 assessed by Kruskal-Wallis test with Dunn’s multiple comparison test (b; AP -3.0~-3.3) or One-way ANOVA with Tukey’s multiple comparison test.
© Exp Neurobiol